Activating SSRS Report Content Types for SharePoint

For information on how to set up a report library and the relevant content types in SharePoint see this previous post – Create A Sharepoint SSRS Report Library

I recently had trouble publishing an SSRS report to SharePoint.  I was unable to find the Report Server content types on the library.  I needed to activate the Report Server Integration Feature in order to be able to add the SSRS content types to the library.  Here is how to do that.

Go to Site Settings

image

Under Site Collection Administration, choose Site collection features

image

Beside Report Server Integration Feature click the Activate button.

image

That’s it, you’re done. Now you will find the Report Server content types listed in the Site Content Types

Manually Deploy SSRS Reports to SharePoint

I have a situation where there is an alternate authentication method in place on SharePoint and deploying reports using the Visual Studio deployment options won’t work.  To get around this while they sort it out I have manually loaded the reports, data sources and shared datasets to SharePoint.  There were a few tricks which I would like to remember so I’ll post them here.

1. Create 3 document libraries:

The first thing I did was create three libraries, one for Reports, one for Shared Datasets and one for Shared Data Sources.  You don’t have to have separate libraries, but I find it more user friendly to keep these items separate.  I don’t want users weeding through data sets and data sources to get to their reports.  Here is how to create these libraries.  The one surprise is to use a content type of Report Builder Report for the Shared Datasets.  I imagine this is to allow you to configure your Dataset to connect to a Data Source.

2. Create (don’t upload) the Data Source.

Navigate to the Data Source library you created. From the Documents tab select New Document.  Do not try to upload a data source you have already created for your report, since, for whatever reason, SharePoint won’t recognize it as a Report Data Source. You need to recreate it.  

image

Configure the data source appropriately. Choose “Stored Credentials” to allow for proxy authentication, and select “Use as Windows credentials”.  Click on the Test Connection button to be sure it is working.  Click OK.

image

3. Upload the Shared Datasets:

Navigate to your Shared Datasets library and from the Documents tab you can “Upload Document” or  “Upload Multiple Documents” depending on how many shared datasets you have. 

image

4. Connect the Shared Datasets to the Data Source:

Connect the shared datasets to the appropriate data source.  Click the drop down beside the dataset and select “Manage Data Sources”.

image

Click on the “DataSetDataSource”, which will have the yellow caution triangle to let you know it has not been configured.

image

Click on the ellipsis and navigate to wherever you created the data source in SharePoint. 

image

Click OK and click Close.  Do this for all the Shared Datasets you uploaded.

5. Upload the Report:

Navigate to the Report library you created.  From the Documents tab select Upload Document and upload your Report Services report.

6. Connect the Report to the Data Source:

From the drop down beside the report select “Manage Data Sources”.

image

Same as step 4, click on the name of the data source that needs to be connected.  Click on the ellipsis and navigate to where the data source is stored in SharePoint.  Click OK. Click Close.

7. Connect the Report to the Shared Datasets:

From the drop down beside the report select “Manage Shared Datasets”

image

From the list of dataset names which need to connected, click on the first one which has a yellow caution triangle beside it.  This lets you know that the dataset has not yet been connected. 

image

Click on the ellipsis and navigate to where you have stored your shared datasets.  Select the dataset.  Click OK. Repeat this for any shared datasets which have not been connected.  Click Close.

You are ready to view your report.  If you get any data source errors, check that the Shared Datasets are all connected correctly to the data source, as well as the report.

Create a SharePoint SSRS Report Library

For whatever reason this type of library is not out-of-the-box.  I have to set it up manually every time.  Here are the steps for this particular client.  They will be similar for other SharePoint/SSRS set ups.  You can follow these instructions to set up an SSRS Data Source library and an SSRS Share DataSet library.

Document type                        Content Type

Report Services Report       Report Builder Report

Data Source                              Report Data Source

Shared DataSet                       Report Builder Report

1. Create a Document Library in SharePoint.

Go to Libraries.  Click Create.  Call your new library “Reports”.

image

2. Allow Management of Content Types.

Click on your library. Go to Library Settings. Click on Advanced Settings.  Change the radio button for “Allow management of content types” to Yes.  Click OK.

3. Add Report Content type.

In the Library Setting under Content Types click on “Add from existing site content types”.  In this case the client is using Report Builder content types for reporting, which will work fine for Report Services reports.


image

From the “Select site content types from” drop down, select “Report Server Content Types”.  Add any content types you would like to maintain in your Reports library.  I prefer to keep data sources and data sets in separate libraries, but some people like to keep them on one library.  Take note that whichever content type floats to the top of your Content Type list will be the Default content type for your library.  This will matter when creating and adding new documents.  Add the default Content Type first, and then any others.  Click OK.

If you don’t see the Report Server Content Types listed in the drop down, you may need to activate them on your Site Collection.  Read this post to find out how to do that – http://thedataqueenblog.azurewebsites.net/2013/05/activating-ssrs-report-content-types-for-sharepoint/

image


4. Delete the Document Content Type.

Under Content Types select the “Document” content type.

image

Select “Delete this content type”.

image

This will make the Report Builder Report content type the default content type.

You are ready to deploy SSRS reports to your SharePoint library.

If you find that you are unable to deploy your reports using the deploy feature in Visual Studio – for example Visual Studio keeps asking you for credentials when you try to deploy – you may want to manually upload the reports and data sources to SharePoint.  Read this post to find out how http://thedataqueenblog.azurewebsites.net/2012/07/manually-deploy-ssrs-reports-to-sharepoint/

SSIS: Connect to PostgreSQL

There is a great blog post on Connecting to a PostgreSQL Instance Using SQL Server Integration Services which you’ll want to read.  I will recap the steps directly from this post:

Installation of both drivers (32-bit & 64-bit) is identical. Here are the basic steps to get the driver working:

  1. Download the latest .msi file for Windows from this location: http://www.postgresql.org/ftp/odbc/versions/msi/
  2. Run the msi file on your SQL Server.
  3. Launch the ODBC Administrator Utility and choose the type of data source you need; File, System or User and click Add.
  4. The ODBC Administrator will present a list of drivers. Scroll to the bottom and you will see two options for PostreSQL; ANSI and Unicode. Select the version you need and click Finish.
  5. The Administrator will present a screen on which you must supply a database name, server name, user name and password.
  6. After you have supplied values for these fields, click the Datasource button and make sure the Use Declare/Fetch box is checked. The driver will fail to retrieve larger datasets if you do not check this box. I have not yet found a satisfactory answer for why this is so.

Now you are ready to build a new connection manager in SSIS and hook it to the PostGRES data source you just created. Use the following settings when building out the connection manager:

  1. Select the .Net ProvidersODBC Data Provider.
  2. Select the “Use connection string” radio button. Using the values you configured in the ODBC Administrator, build a connection string as follows: Dsn=PostgreSQL35W;uid=User1
  3. Enter the User name and Password in the fields provided.
  4. Test the connection and you should be ready to go.


Here are a few bits of information I’d like to add to this excellent blog post, mainly for my own purposes should I run into this again:

I noticed on the PostgreSQL msi page that there were several versions of the drivers.  I took the most recent of the 32bit, psqlodbc_09_01_0100-1.zip.  The 64 bit drivers have “64 bit” in the name.

The 32-bit ODBC drivers for PostgreSQL get installed here C:Program Files (x86)psqlODBC

After installing the 32 bit driver per the instructions, in your Visual Studio solution be sure to change your Project Properties – Debugging – Run64BitRuntime property to False. This will force it to run in 32-bit mode.   

If you are triggering your package from SQL Server Agent, set the SQL Server Agent job to run in 32-bit mode

For SQL2012, be sure to put the password in a Project Parameter so it is retained in the package on deployment to Integration Services, and doesn’t get stripped out due to package protection.

Use a SQL Server data source for an InfoPath pick list

This is one in a series of posts on using InfoPath. If you are new to SharePoint lists and InfoPath you might want to start with the Best Practices.  The example I will be using here is a continuation of the one started in the Best Practices post.

Best Practices for Cascading SharePoint Lists using InfoPath Forms

Dynamically filter a drop down on your SharePoint list by another user selected value

Before you even start, be aware that using this method allows the password for the SQL connection to be  stored in  text format directly in the data connection.  Be sure you put security measures in place to disallow others from navigating to the connection file in the SharePoint library, and create a database login with a low level of read-only security to information which is not sensitive.  We are using the data connections for simple pick lists, so this shouldn’t be an issue.

Create a SharePoint library to store the data connections for InfoPath.  The Type of library is a Data Connection library. Call it DataConnectionsInfoPath.  The data connection information for the InfoPath connections will be stored in text format so be sure that security to this folder is limited to only administrators.

Create a SQL login to the database to which you will be connecting to get the data used in the pick lists for SharePoint.  The login information will be stored in the data connection as text, so be sure to create a separate login with read only capabilities to only those tables required for the InfoPath pick lists used in SharePoint.  Choose a password that is not commonly used by other admin connections. (C’mon, you know you reuse passwords).

Create a view in your database from which the pick list will be fed.   The pick list can only be sourced from one table, so by creating a view you can control the values that show up in that table. If you need to filter out, change or add any values in the future, you can use the view to do it without having to change the data connection or the InfoPath form.

Navigate to the SharePoint list which has already been set up, in this case Supply Chain Scorecard Metrics from my previous blog post.  Open the InfoPath form by clicking on the Customize Form button in the List menu.  

To get the pick list for Site from a SQL Server view do the following.

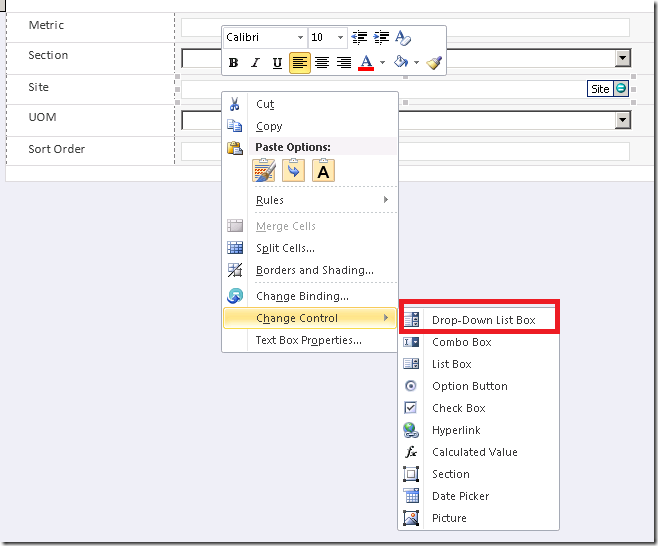
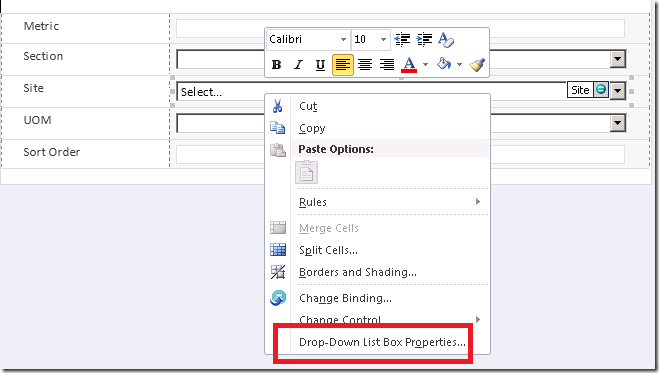
Right click on the Site text box on the form and change the control to a drop-down list box.

image

Right click again and edit the properties.

image

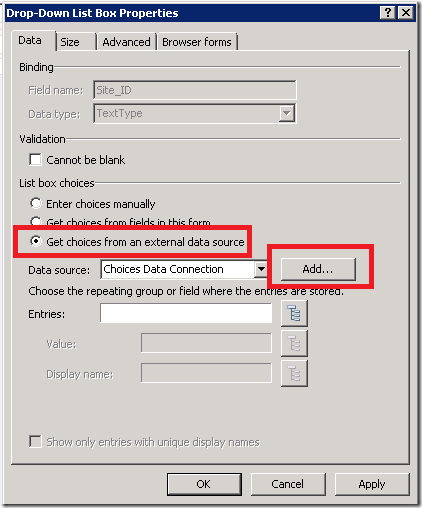
Select Get choices from an external data source.  Click the Add button beside Data source.

image

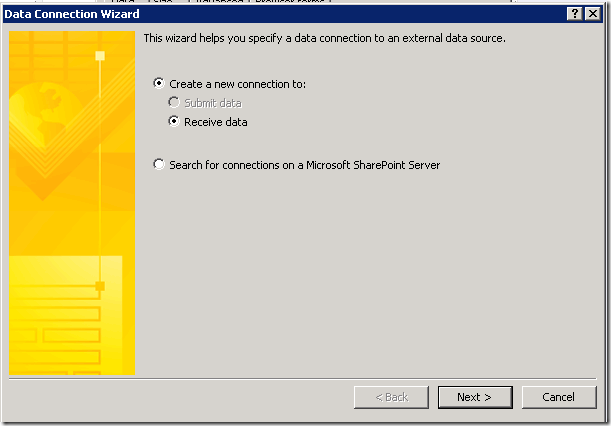
Create a new connection to Receive data.

image

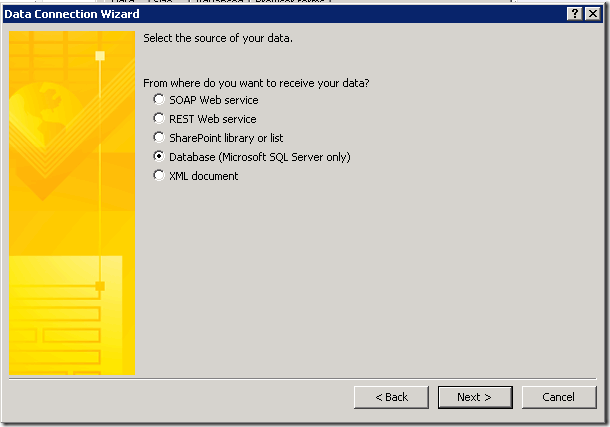
Receive data from a Database (Microsoft SQL Server only)

image

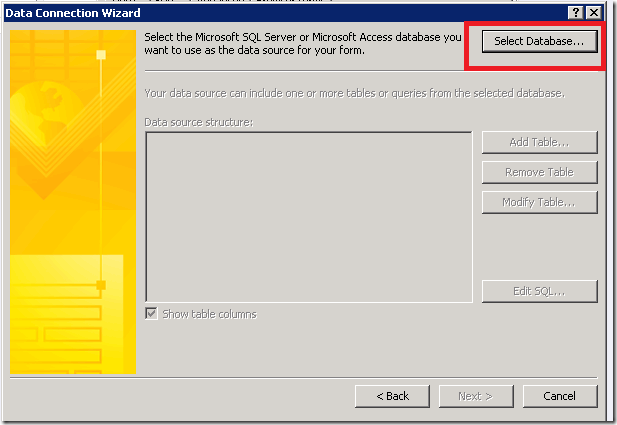
Click on the Select Database button.

image

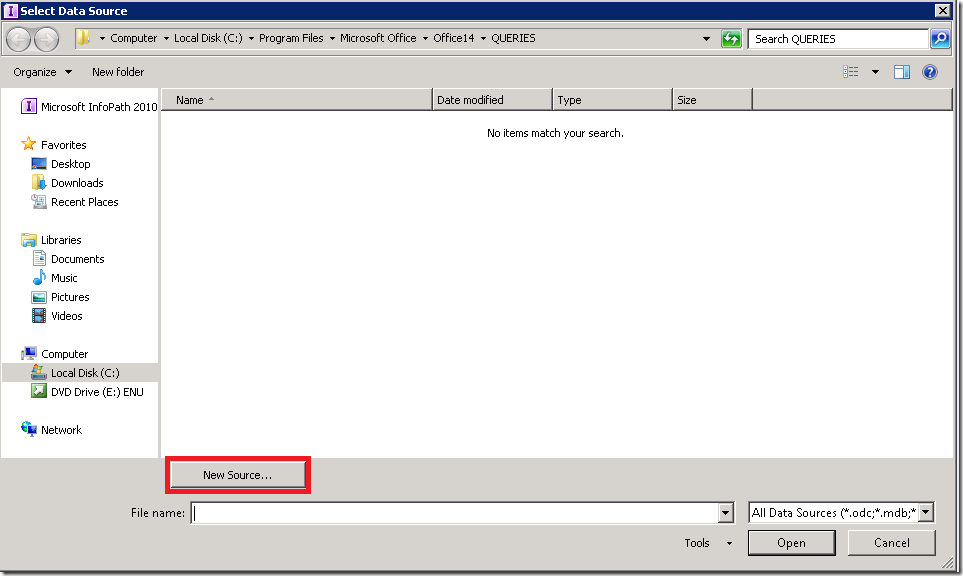
Click on the New Source button

image

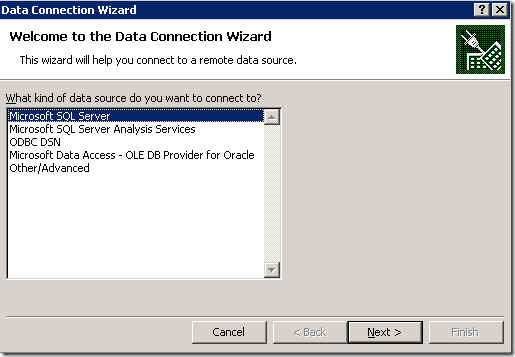
Select Microsoft SQL Server

image

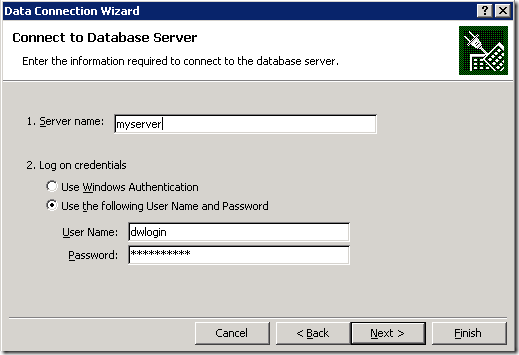
Enter your server name and use the login you created at the beginning of this exercise.

image

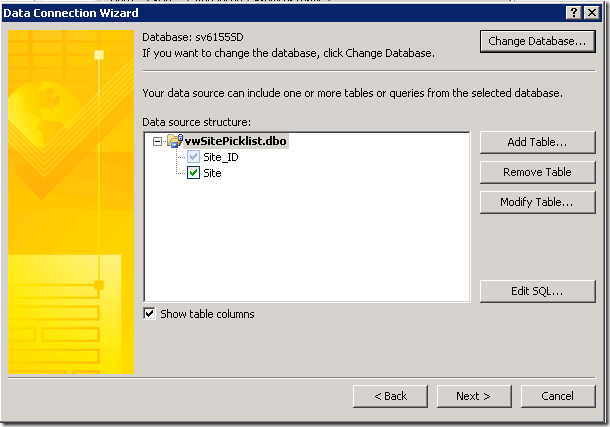
Select the database where your pick list data is stored, and select the view you created at the beginning of this exercise.  The InfoPath data connection that you will be sharing in the SharePoint library will have the query imbedded in it, so you can’t just have a connection to the database.  You need to choose a specific table.

image

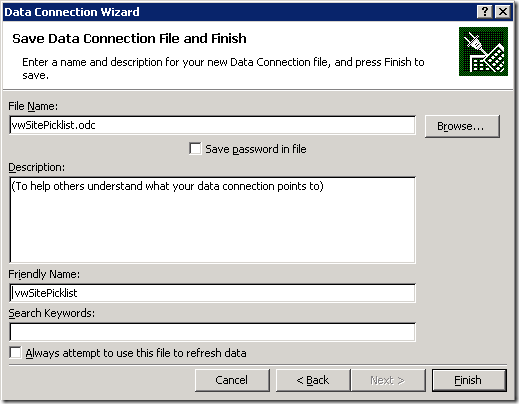
Save your connection file.

image

Re-enter you database password.  Click Yes to save your password into the InfoPath connection file in plain text.

image

Click Next.

image

Click Next, Next, Finish.

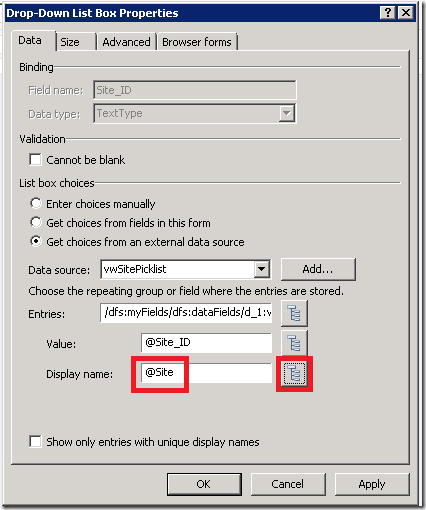
Leave the Value as @Site_ID and change the Display name to @Site by clicking on the folder tree to the right and selecting Site.

image

Click OK.


PUBLISH YOUR INFOPATH DATA CONNECTION TO SHAREPOINT

From the Data menu, select Data Connections.

image

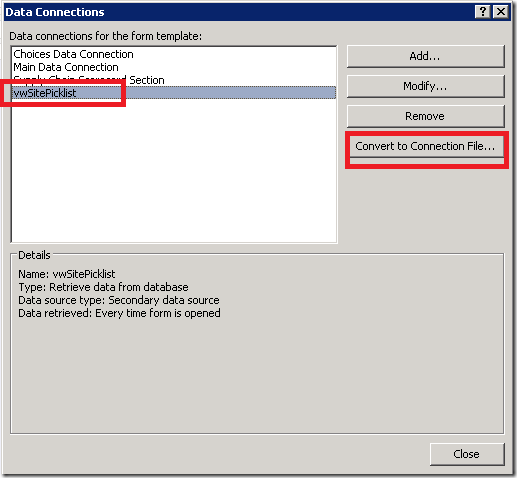
Select vwSitePicklist and click on the Convert to Connection File button.

image

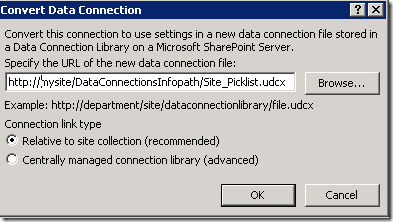
Key in the location of your InfoPath Connection library you created earlier, and add a name for the data connection you are creating.  Give it a suffix of .udcx.  Click OK.  It will take a minute or two to create the connection.

image


Click Close.

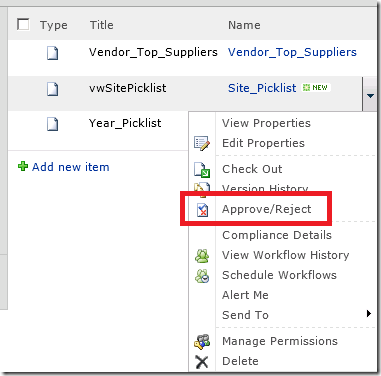
Navigate to your SharePoint library that contains the InfoPath data connections.  You will see your new data connection here.  Notice that the Approval Status is “Pending”.  You need to change it to Approved before you can use the data connection.

Click on the dropdown beside your new data connection.  Select Approve/Reject.

image

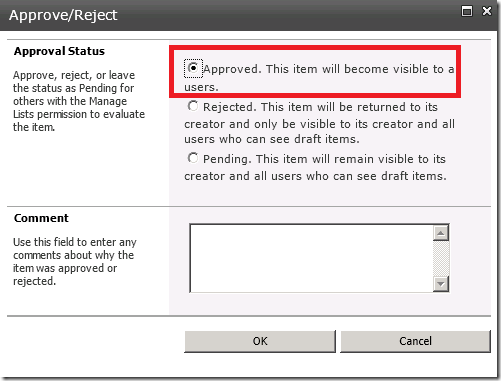
Select Approved.  Click OK.

image


Now go back to InfoPath and publish your InfoPath form.  Navigate to your SharePoint list and Add a new item.  You can choose a Site from the Site pick list which is pulling directly from SQL Server.

Pretty cool, right?  No need to push data into SharePoint and keep it synchronized, just pull directly from SQL Server.  I love it!

Best Practices for Cascading SharePoint Lists using InfoPath Forms

This is the first in a series of posts on using InfoPath.  You will find links to the others at the end of this post.

I find on many occasions that users have a need to capture some pieces of information but don’t want to build an application to capture it.  SharePoint lists can be a useful way to capture this data, if you plan carefully and use best practices.  At times users need to control several different pieces of related information, and would like to use information from one SharePoint list or SQL Server table as a pick list or drop down in another SharePoint list.  This can be effective if you put the right controls in place to keep the data in synch and to maintain data integrity.

You could use a SharePoint Lookup column in your list to keep this data in synch, but doing so can have complications.   I avoid Lookup columns as a rule, since they store the underlying values as a mash up of SharePoint ID and description, looking something like 12;#Description. When you pull this into your database you have to do some work to get the data into useable form.  And if you want to refer to or display any other information from the lookup list into the cascaded list using InfoPath you can’t do it.  What I prefer to do store is the ID of the item (sometimes the SharePoint ID and sometimes the underlying ID from the data warehouse), and use InfoPath to get the description of the item and any other relevant fields.  I then use the ID for any joins on the data warehouse side of things, and I use SSIS to keep the descriptions updated across the cascading lists. So if Vendor Name got updated in a lookup list, I would join on the ID and use SSIS to update the description in any cascaded lists, since we are not using a SharePoint Lookup column to do this for us.

A combination of SharePoint column settings, InfoPath and SSIS is a great way to put the required controls in place.  It takes a bit to get the hang of it, but it has a lot of flexibility to enforce data integrity and to keep the descriptions in synch between lists.  The only drawback to using InfoPath forms is that users can no longer use the Datasheet View to enter and update data.  With large lists this can be a problem for users, so you need to decide if Datasheet View is a requirement for your users before using InfoPath forms.

When I design a cascading list scenario, I like to build the underlying SQL tables and report first, get the structures exactly as needed, and then build the SharePoint lists based on the existing table structures.  Without doing this, a lot of changes can be discovered along the way, and having to go back and change the SP List, SSIS Package, SQL tables and reports is not an efficient use of time.  Best to build the tables and report, hammer out the correct structures and build the SharePoint lists and InfoPath forms on top of that. 

For the step-by-step I will build 4 lists where users can enter data to control a department scorecard.  These 4 lists will be used to populate these 5 tables which have already been defined:

DIM_Supply_Chain_Goal

image


DIM_Supply_Chain_Section

image


DIM_Supply_Chain_Metrics

image


FACT_Supply_Chain_Target

image

FACT_Supply_Chain_Actual

image

I won’t be showing you the SSIS packages to populate these tables, as that is another subject. I am simply demonstrating how to can use SharePoint lists to capture data with a good user experience.  You can then use these lists to populate underlying tables of a different structure using SSIS.  For more details on pulling the data out of SharePoint lists using SSIS please see my previous post – How to use a SharePoint list as a data source in your SSIS package.

Users will be able to update the values for these tables from SharePoint using InfoPath forms.  SSIS will be used to import the data into SQL Server and populate these tables.  The end result will be a department scorecard where users can control the values for actuals and targets, as well as the sort order of all of the goals, sections and metrics.  Some of the actuals will be calculated by SSIS using data from an ERP system, and some will be user controlled.  The targets are all user controlled.  And the descriptions and sort order of Goals, Sections and Metrics are user controlled. 

The lists are designed with the best user experience in mind, rather than building them to match the underlying tables.  Some data transformation will be done by SSIS to extract the data from the lists and load it in the correct format into the tables.

SharePoint List creation, best practices:

Column Settings:  The first step is to create the SharePoint lists which will feed the tables above.  It is important to match the data types in the list to those in your underlying tables as closely as possible, but only for those columns that the user will be editing.  For example if you are expecting the Goal field to have no more than 50 characters, then put that restriction on the column in your list. 

For any calculated columns which are concatenations of fields, leave the default of 255 characters, since you may not know exactly which fields you will be concatenating yet.

For user Sort Order fields, make them Number type with 0 decimal places and choose a maximum value so you know how many leading zeros you will need to add to the ListSort column.  More on that later. 

When it comes to storing something like Year, you’ll want to make this a text field, since the display of Number will put a comma for  thousands.  So 2012 would look like 2,012. You could either have 2 fields for year in your list, one for display and one for the value to be sent to the data warehouse which makes sense in the case where a user could key in the number, or you could use a dropdown to control what the user can choose – store the value as a string, and then convert it on the way into the data warehouse.

Column naming convention: When naming your fields don’t put any spaces,  The underlying name for that column captured behind the scenes will have special characters added in place of the spaces. When you get to SSIS this can be annoying.  Avoid spaces when first naming the field, and then go back and rename the field with the space.  The original value will be retained underneath the hood, but users will to see the space on the List View making the user experience better.  for example, name the column Sort_Order when you first create it, and then go back and change it to Sort Order.  You only need to rename those columns which will be visible in the List View, since this is strictly for user experience.

Built-in columns for display descriptions, sort order, item uniqueness and item title: Some additional best practices I have adopted for data integrity and for flexibility in changing logic without changing underlying structures is to add some calculated columns.

ItemDescription – The description stored in this column can be pulled into cascading lists to get the full description displaying in the list downstream. I have InfoPath populate it with whatever combination of descriptors make the most complete description of that list item to be displayed downstream.

UniqueItem – Be sure to check off Enforce Unique Values when creating the UniqueItem column. Since we are using InfoPath to control the user experience it makes sense to put all the logic to populate these fields in InfoPath, rather than creating calculated columns in our list.  We will concatenate the appropriate combination of data to define a unique list item, and the Enforce Unique Values property will throw an error if a user tries to create a duplicate item. 

ListSort – I also add a column called ListSort in which I can place the combination of values by which the list view should be sorted.  SharePoint only allows you to sort a list view by up to two values.  By concatenating the combination of values into one field it makes it very easy to sort your list.  If you will also be including a numeric Sort_Order field which users can control, be sure to set a maximum value that they can enter.  This will be important when you use this Sort_Order to populate your ListSort fields downstream in the cascading lists.  For example if you are sorting your Section list by the Goal sort and then the Section name, you will need to concatenate these fields.  SharePoint sorts numbers stored in a text field as text, so the numbers 1,50 and 100 would be sorted as 1, 100, 50.  Since we are using the ListSort text field as our best practice for all lists, we will want to add some leading zeros to the Sort_Order when populating the ListSort.  The maximum value will tell you how many leading zeros to add.  If your maximum value is 999, you will need to add up to 2 leading zeros.  As a best practice make the maximum value for your Sort_Order 999,999 and concatenate 6 leading zeros. This will become clear in our example.

Title – I also prefer to leave the Title column as a calculated field, to be a combination of one or more of the values a user will enter into the list.  This gives me complete flexibility to have the Title reflect a good description of the list item without restricting that description to only one field in the list which a user may key in.  Keep this at default size of 255 since it may be a concatenation of fields.

You end up with 4 additional calculated columns in your list, and although in some cases they may all contain the same information, you have built in the flexibility to change display descriptions, sort order, item uniqueness and item Title without have to change the structure of your list or the SSIS packages.  You can change the logic in the InfoPath form without having to touch the underlying structures.

Create the SharePoint Lists:

List 1. Supply Chain Scorecard Goal

Change the Title field to Goal, and add a column called Sort_Order of type Number with 0 decimal places.  To enforce the data integrity, require this field to have information and Enforce unique values.

image

After you save the Sort_Order column, go back and rename it to Sort Order (with a space). The end result is a list with 4 columns, Item (title), Goal,  Sort Order, and UniqueItem.  While this particular list may not need the addition of Item and UniqueItem, since Item, Goal and UniqueItem may all end up being the same value – it is good design to include all three columns to give you the flexibility to change it later.

image

List 2. Supply Chain Scorecard Section

image

List 3. Supply Chain Scorecard Metrics

image

List 4. Supply Chain Scorecard Actuals

image

Modify the List View:

Go back and remove any columns from the List View which you do not want the users to see – including UniqueItem and ListSort, reorder the columns as required, and set the view to sort by ListSort.  

Do this by selecting your list, clicking on the List  tab in the SharePoint menu and selecting Modify View.

image

Deselect any items you don’t want to show up in the view. Reorder by changing the Position from Left dropdown.

image

In the “First Sort by the column:” drop down select the ListSort column.

image

Do this for all of the lists.

Edit the First InfoPath Form:

Start with the first pick list in the cascade of lists.  The one that does not depend on any of the other lists.  It would be the highest level in the hierarchy of the cascade, in this case Supply Chain Scorecard Goal.  This list does not choose a value from any other list, but the Supply Chain Scorecard Section list will use the Goal list as a pick list.

InfoPath Form 1. Supply Chain Scorecard Goal

Although this list does not depend on any of the others, we would like to use InfoPath to allow users to edit the two editable fields – Goal and Sort Order, and have InfoPath populate the underlying calculated fields of Title, ItemDescription, UniqueItem and ListSort.  In this case the list is a very simple one, so each of these 4 calculated fields will contain just one value – Goal.  The list will be sorted by Goal, the uniqueness of the list will allow only one row for each Goal description, the title will display the Goal and the description passed on to the cascading lists will be Goal.

Open your list.  In the SharePoint menu go to the List tab and select Customize Form.

 image

A dialog box will ask if you would like to open the form in Microsoft InfoPath.  Click OK.  InfoPath will open, and the default form for your list will appear with all of the underlying fields on it.

image

For the calculated fields which the user does not need to see, highlight the row

image

and click delete.

image

Now only the two fields remain, which the user will populate.

UNIQUEITEM

To populate the calculated fields look at the Fields pane on the right hand side of the screen. Right click on the UniqueItem field and select Field Properties.

image


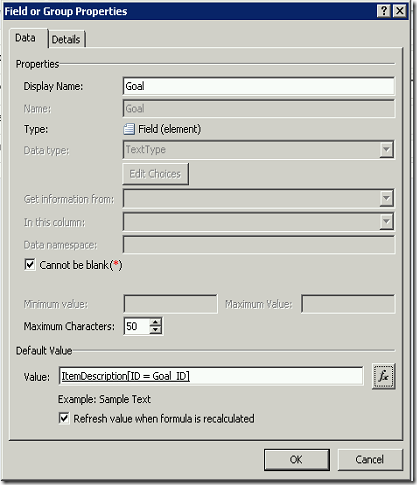
Beside the Default Value click on the expression editor button

image

Click on the Insert Field or Group button

image

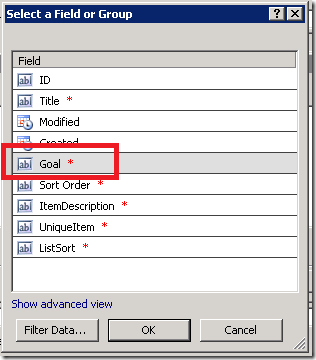
Select the Goal field and click OK.

image

Your formula now looks like this:

image

Click OK.  Make sure the checkbox is checked which says “Refresh value when formula is recalculated”.  This will ensure that each time the Goal description is changed, the UniqueItem value will also be updated to the new Goal description.

image

Click OK.  For now, repeat this for each of ItemDescription, Title and ListSort. Be sure that you populate all four calculated fields correctly before going to the next step, since we have required that these fields be populated.  If they are blank you will not be able to add any items to your list.

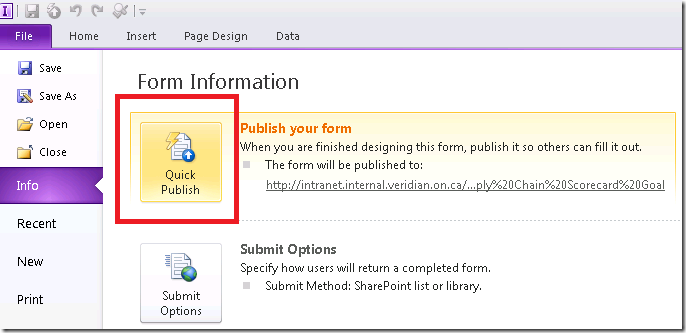
Click on the InfoPath File menu and click the Quick Publish button. This will publish your changes back to SharePoint.
image

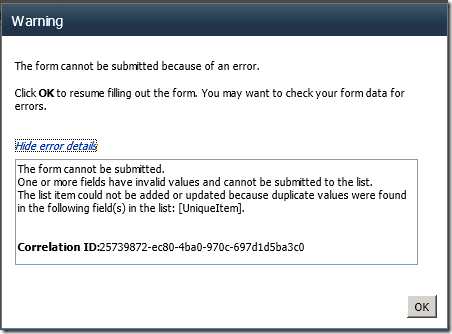
Now you can add some items to your list. You will need to do this to have some data for the next step, which is to edit the InfoPath form for the cascading SharePoint list.  You will want to test that it is working, so you need to have at least one item in the Goal list.  Add some items – add Goal = Improve, Sort Order = 1.  Now add Goal = Improve, Sort Order = 2.  Notice that you get an error message stating that there is a duplicate value for UniqueItem.  We selected Enforce unique values on the UniqueItem column to ensure users do not accidentally enter duplicate items.  UniqueItem lets you control what constitutes a unique value.
image

Click OK and change the Goal = Maintain.  Save the item.  Add one more item – Goal = Track, Sort Order = 3.  Your list is now complete.

TITLE

Take a look at the List View.  Notice how the Title is aligned to the left and Sort Order is to the extreme right.  This doesn’t seem like the best user experience. 

image

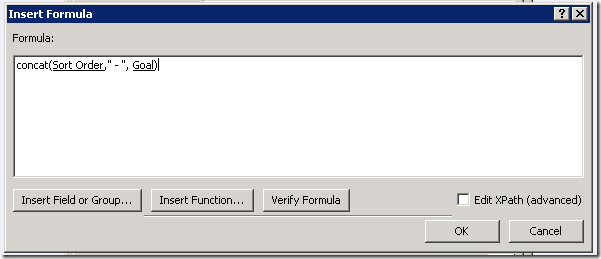
Let’s change the logic in our InfoPath form to make the Title calculation a concatenation of Sort Order and Goal. Then we can remove the Sort Order field from our List View.

Go back to the InfoPath form you edited.  It should still be open.  In the Fields pane on the right hand side of the screen right click on the Title field.  Select Field Properties.  Click on the expression editor button for the Default Value.  Delete the current formula which says Goal.  Click on the Insert Function Button.

image

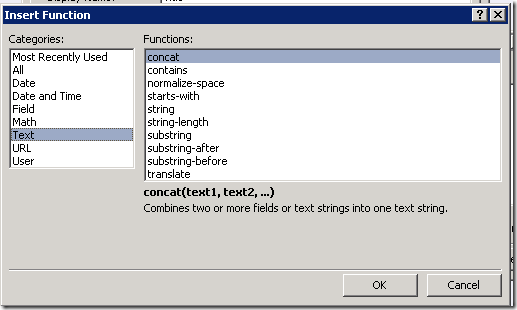
Select the Text Category and then select the concat Function.
image

Click OK.  You can double click where it tells you, but we are going to delete everything after concat( and then click on the Insert Field or Group button. Select the Sort Order field.  Type a comma.  Type “ – “.  Type a comma.  Click the Insert Field or Group button.  Select the Goal field.  Type a close bracket.  You should end up with this formula.
image

Click OK. 

Publish the Form.  File –> Info –> Quick Publish.

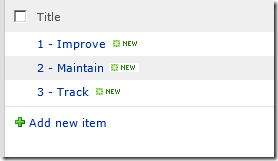
Go back to your SharePoint list.  The changes to the title will not take effect until the Goals are edited.  Open the Edit window for each of the three items in your list and save the items.  The Title has changed to the new value.
image

Modify the view and remove the Sort Order field from the View, since it is now part of the Title. 

ITEMDESCRIPTION

In your downstream cascading lists you will want a good description of your item.  It may be the same as Title, but it may not.  By having this field in place as a best practice, you can control how it will look. 

For now we will leave the ItemDescription = Goal.

LISTSORT

Since we want the List to sort by the numeric value of Sort Order, and want to keep with our best practices of using ListSort as our standard sorting mechanism which will also be used downstream, we need to edit the calculation for ListSort.  If we leave the view to sort by ListSort as it is now, it will sort alphabetically by Goal. 

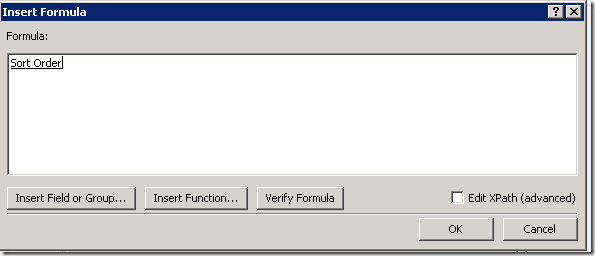
Open your InfoPath form if it is not already open. Right click on the ListSort field and select Field Properties. Click on the expression editor button for the Default Value.  Click on the Insert Field or Group button and choose Sort Order.  Click OK.  Your formula should look like this.
image

Click OK, OK and publish the form.  Go to your list and for each item in turn select Edit Item, and then Save.  The ListSort values will not get updated with the new value until the items are edited, since the value is only refreshed when the formula gets recalculated.  Add a new item to your list, Goal = Test Sort Order = 11.  Since ListSort is a text field the list is sorting alphabetically by the Sort Order value we put in the ListSort field.  This does not give the desired results since numbers stored in a text field get sorted like this:

image

At this point you might decide to just change the sort order on your list to use the Sort Order field, but when you want to use this downstream in your cascading lists you are going to want to be able to sort by a concatenation of Goal sort order and other sort orders which may not be numeric.  For example you might want to sort the Section list by the Goal sort order and then the Section description.  We can do this by adding some leading zeros to the Sort Order value when storing it in the ListSort.

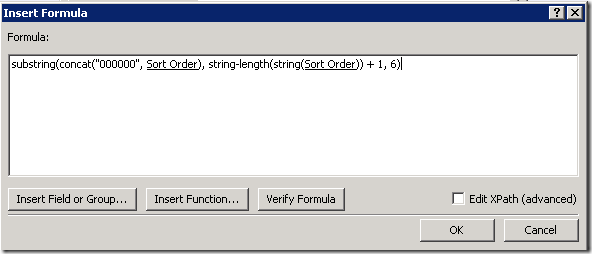
Go back to your InfoPath form. Right click on the ListSort field and select Field Properties. Click on the expression editor button for the Default Value. Create the following formula using the Insert Function button and the Insert Field or Group button. You can type in the functions, but must select the Sort Order field using the Insert Field or Group button.

     substring(concat("000000", Sort Order), string-length(string(Sort Order)) + 1, 6)

Notice that we are adding 6 leading zeros to the Sort Order value and then choosing the last 6 characters of the resulting value.  Your formula should look like this.
image

Notice that we didn’t have to change the data type or structure to implement this change to the value in ListSort, but simply changed the logic.  Now go back and Edit and Save each of the items in the list.  Notice that they sort correctly now.

image


Use the First SharePoint list as a Pick List in the Second Cascaded List:

Close InfoPath if it is still open, and navigate to your second list – Supply Chain Scorecard Section.  This list will use the Goal SharePoint list as a pick list. 

Open the list, navigate to the List tab and click on the Customize Form button on the SharePoint menu. Click OK on the message.  Highlight and delete the rows in the form for Title, Goal, ItemDescription, UniqueItem and ListSort.  Edit the label on the form for Goal ID to Goal, and Display Toggle to Display.  You should end up with a form that looks like this:

image

LOOKUP AND STORE ID FROM ANOTHER LIST

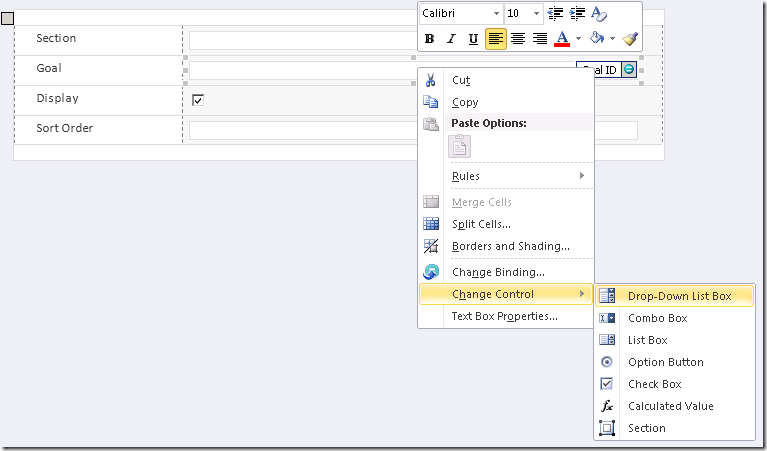
In the text box for Goal ID on the form, right click and select Change Control –> Drop-Down List Box.
image

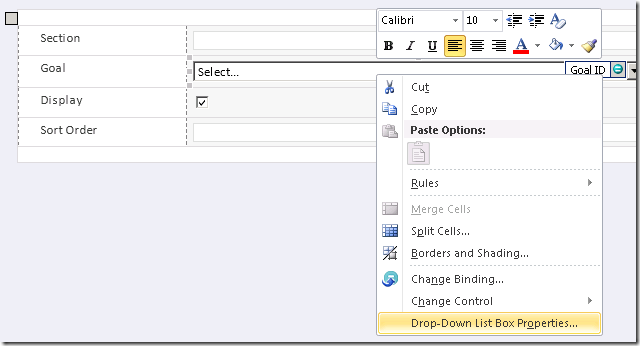
Right click on it again and select Drop-Down List Box Properties.
image

Click on the radio button Get choices from an external data source.  Click on the Add button beside the Data Source.

image

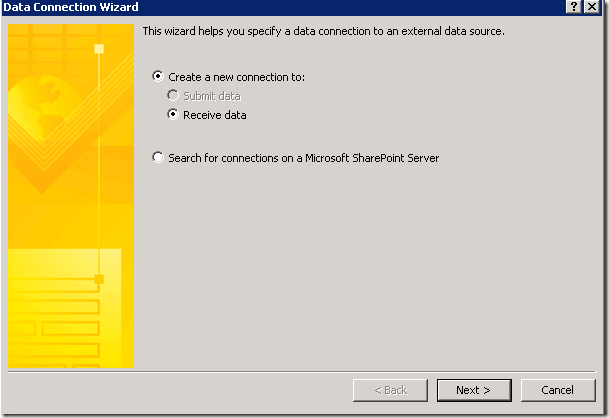
Leave the default values of Create a new connection to Receive data.
image

Click Next.  Select SharePoint library or list.

image

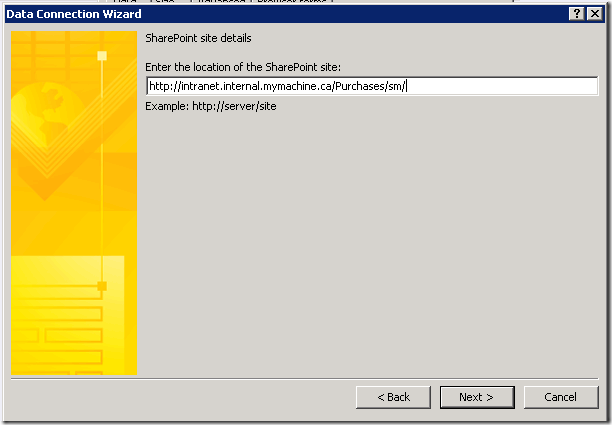
Click Next.  Using Internet Explorer navigate to your Goal list.  Copy the URL and scrape out anything to the right of and including Lists.  This is the SharePoint site where the list is stored.  Enter this value in the Data Connection box.
image

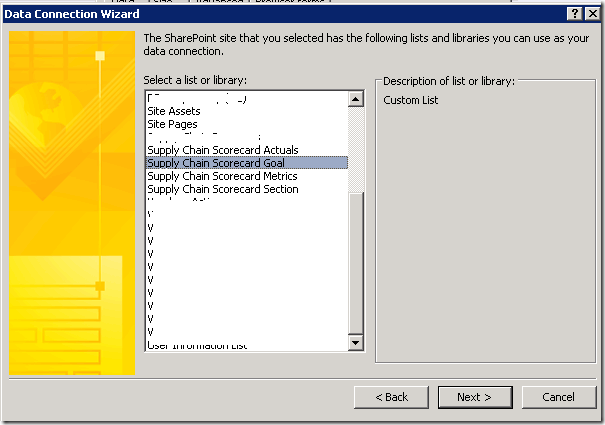
Click Next. Select the Supply Chain Scorecard Goal list.
image

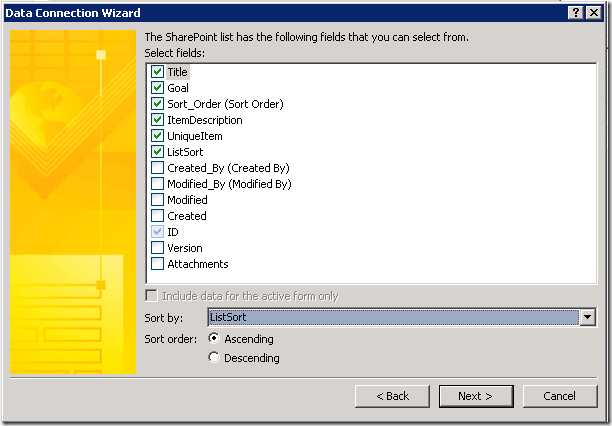
Click Next.  Select all of the fields you created, and sort by ListSort.  You will be using more than one field from this list, and it is easiest if you have already included the fields in your data connection.
image

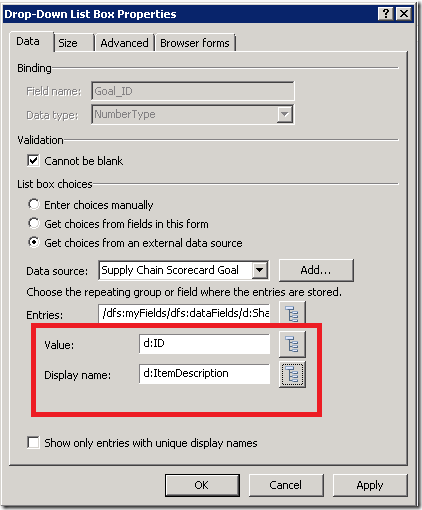
Click Next, Next and Finish.  In the Value field of the Drop-Down List Box Properties window click on the Tree button.  Select ID.  You will be storing the SharePoint ID of the Goal in the Goal_ID field of your Section list.  Change the Display name to ItemDescription.
image

Click OK.  This will store the ID, but display the ItemDescription to the user in the InfoPath form. 

LOOK UP DESCRIPTIONS FROM THAT LIST

We would also like to store the ItemDescription so we can display it in our list, and for that we need a calculated field to go and fetch the description matching the ID now stored in the Goal_ID field.

In the Fields pane right click on the Goal field and select Field Properties.  Click on the expression editor beside the Default Value.  Click on the Insert Field or Group button.  Click on the Show advanced view link.

image

In the Fields drop down change the data connection to the Supply Chain Scorecard Goal connection you created when populating the Goal ID.

image

Open up the dataFields toggle and the SharePointListItem_RW toggle.  Select ItemDescription.  This is where the best practices come in handy, since we already know that this field was created specifically to display a useful description in cascaded lists.  Now, DON’T CLICK OK.  This is something you have to get used to.  You need to filter the data first to get the corresponding Goal description which goes with the Goal ID already stored in your list.  If you make a mistake and click okay now, you will have to go back and navigate the data connections again.  It doesn’t remember where you were in the tree.  Click on the Filter Data button.

image

Click on the Add button to add a filter.  In the first drop down select the ID column.  You are building an expression that will find the ItemDescription that corresponds to the ID stored in your main data connection.  Leave the middle drop down as ‘is equal to’.  Select the third drop down.  Click on ‘Select a field or group’.

image

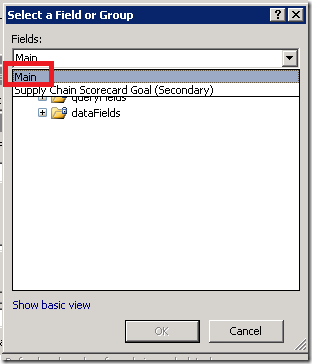
In the Fields drop down navigate to the Main data connection.

image

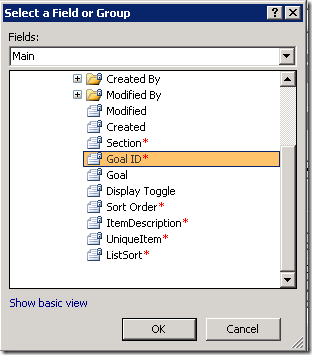
Open up the dataFields toggle and the SharePointListItem_RW toggle. Select the Goal ID field.

image

Click OK.  Your filter condition looks like this:

image

Click OK.  Your Filter Data looks like this:

image

Click OK and OK again.  Your formula looks like this.

image

Please note that you couldn’t just type this expression into the box because the context of the data connection is stored within the filter. If you are interested you can select the Edit Xpath checkbox to can see the underlying code.

Click OK.  The field properties looks like this.

image

Be sure that the Refresh value checkbox is selected.  Click OK.

POPULATE THE CALCULATED FIELDS

Just as we did for the Goal SharePoint list, we also need to populate the calculated fields in this list. 

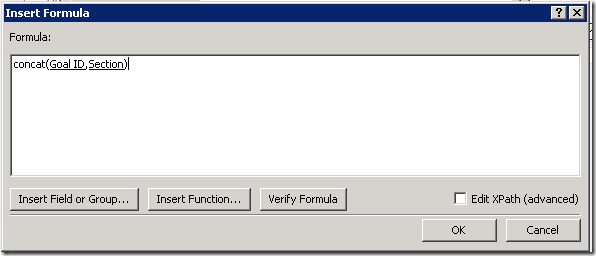
A UniqueItem for this list will be a combination of Goal ID and Section name, since we could potentially have a Section of the same name in more than one Goal.

image

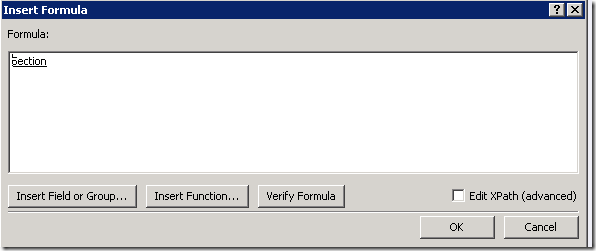
Title will be just Section

image

ItemDescription, to be used downstream, will be Goal plus Section

image

ListSort needs to incorporate the ListSort of Goal as well as the ListSort for Section.  If a user were to change the sort order of the goals, we would want the Section list to be reordered accordingly.  So we need to go and get the ListSort for Goal, and then concatenate it with our formula ListSort.

Right click on the ListSort field and paste our formula into the Formula box.

        substring(concat("000000", Sort Order), string-length(string(Sort Order)) + 1, 6)

Delete the first reference to Sort Order and replace it by clicking on the Insert Field or Group and selecting Sort Order.  This will put the XPath context of Sort Order into the formula.

image

Do the same with the second instance of Sort Order.  Your formula should look like this.

image

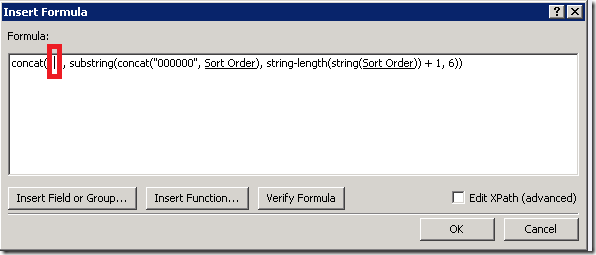
We want to concatenate the ListSort value from our Goal in front of this formula.  Type “concat(   , “ at the beginning of the Formula window and add a “)” bracket at the end of the formula.  Put the cursor after the “(“ .    You are about to insert the ListSort value for Goal into the formula so the cursor must be in the right position. Your formula looks like this – cursor is highlighted in red.

image

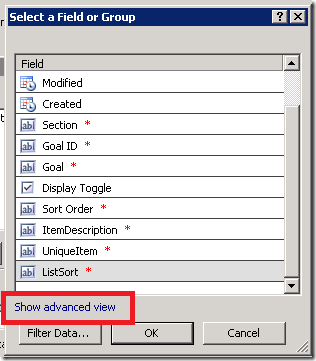
Click on Insert Field or Group.  We are going to follow the same steps we used to get the Goal description.  In the Select a Field or Group window select Show advanced view.

image


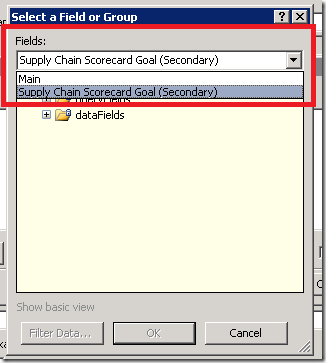
In the Fields drop down change the data connection to the Supply Chain Scorecard Goal connection you created earlier.

image

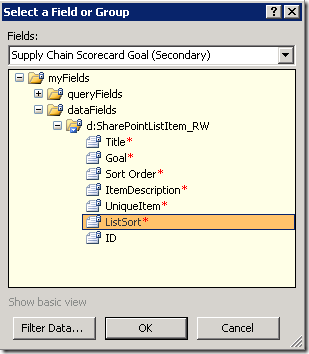
Open up the dataFields toggle and the SharePointListItem_RW toggle. Select ListSort. This is another spot where the best practices come in handy, since we already know that this field was created specifically to sort the goal list. Now remember, DON’T CLICK OK. You need to filter the data first to get the corresponding Goal description which goes with the Goal ID already stored in your list. If you make a mistake and click okay now, you will have to go back and navigate the data connections again. It doesn’t remember where you were in the tree. Click on the Filter Data button.

image

Click on the Add button to add a filter. In the first drop down select the ID column. You are building an expression that will find the ListSort that corresponds to the Goal ID stored in your main data connection. Leave the middle drop down as ‘is equal to’. Select the third drop down. Click on ‘Select a field or group’.

image

In the Fields drop down navigate to the Main data connection.

image

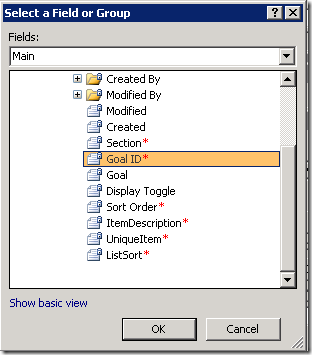
Open up the dataFields toggle and the SharePointListItem_RW toggle. Select the Goal ID field.
image

Click OK. Your filter condition looks like this:

image

Click OK. Your Filter Data looks like this:
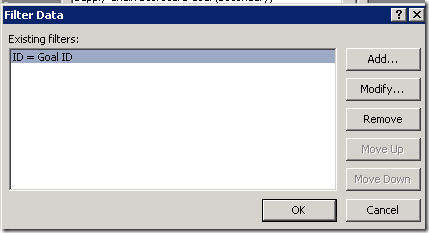
image

Click OK and OK again. Your formula looks like this.
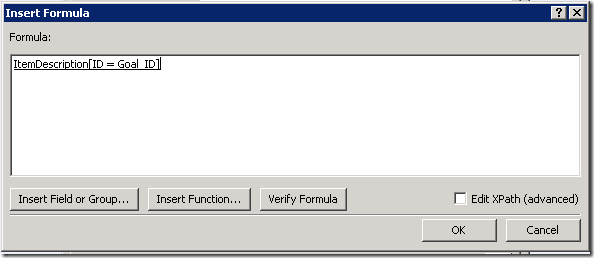
image

Click OK and OK again.  Publish your form.

Go to your Section list and add a few items.  Notice that even if you put a lower Sort Order with a Maintain goal it gets sorted after the Improve goal.

Use the Second SharePoint list as a Pick List in the Third Cascaded List:

I’m not going to do as much detail on the screenshots for this one, since a lot of it is rinse and repeat.  I’ll tell you the steps.

  1. Navigate to the third SharePoint list – Supply Chain Scorecard Metrics.
  2. Open the InfoPath form by clicking on the Customize Form button in the List menu.
  3. Remove all the rows in the form except for Metric, Section ID, Site, UOM and Sort Order.
  4. Set up the Section ID lookup:
    1. Edit the Section ID label to say “Section” and right click on the textbox and Change the Control to a Drop-Down List Box.
    2. Right click again and select Drop-Down List Box Properties.  Select Get choices from an external data source
    3. Click the Add button beside the Data source. 
    4. Create a new connection to Receive data.
    5. From a SharePoint library or list
    6. Enter your SharePoint site URL
    7. Select the Supply Chain Scorecard Section list.
    8. Select all of the fields that you created.  Sort by ListSort.
    9. Next and Finish.
    10. Change the Value field to ID and the Display name to ItemDescription.  Click OK.
  5. Edit the Section field properties.
    1. Right click Section, Field Properties.
    2. Click on the expression builder button beside Value.
    3. Click on Insert Field or Group.  Click on Show Advanced View.
    4. Select Supply Chain Scorecard Section.  Navigate to dataFields and then to ItemDescription.
    5. Click on Filter Data.
    6. Click on Add.
    7. Select ID in the first drop down, leave “is equal to” in the second drop down.
    8. In the third drop down choose Select a field or group. Change the data connection in the drop down to Main.  Navigate to Section ID.  Click all of the OKs.
  6. Edit the Title field properties.  Concatenate the Metric and Site field.
    • concat(Metric, " ",Site)
  7. Edit the ItemDescription field properties.  Concatenate Section and Metric and Site.
    •      concat(Section, " – ", Metric, "  ", Site)
  8. Edit the UniqueItem field properties.  Concatenate the Metric and Site field.
    • concat(Metric, " ",Site)
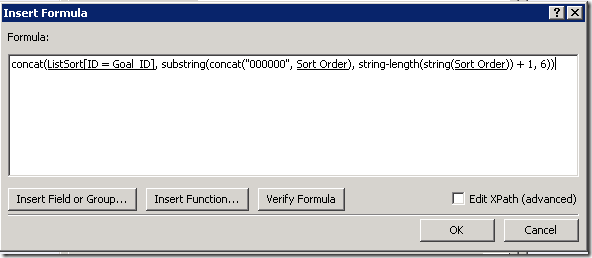
  9. Edit the ListSort field properties.  It will end up looking like this:   concat( ListSort[ID = Section_ID] ,substring(concat("000000", Sort Order), string-length(string(Sort Order)) + 1, 6))
    1. Enter the formula for the List Sort and set up to concatenate the Section List Sort field to the beginning of it. 
      • concat(  <insert Section List Sort here>   ,substring(concat("000000", Sort Order), string-length(string(Sort Order)) + 1, 6))
    2. Show advanced view.  Select the Supply Chain Scorecard Section data connection.
    3. Navigate to dataFields and select ListSort.
    4. Select the Filter Data button.  Click Add.
    5. Select ID in the first drop down, leave “is equal to” in the second drop down.
    6. In the third drop down choose Select a field or group. Change the data connection in the drop down to Main. Navigate to Section ID. Click all of the OKs.
  10. Publish the InfoPath form.

Navigate to your list and add some items.  All should be working as expected.

Use the Third SharePoint list as a Pick List in the Fourth Cascaded List.

This is almost a repeat of the last section.  The difference is that the user will not be choosing a sort order.  The Supply Chain Scorecard Actuals list will contain the Metrics for each year.  This means the ListSort will be based on Year and Metric ListSort.  UniqueItem will be based on Year and Metric ID.  ItemDescription won’t be important because there will be no other lists downstream from this one.  I’ll write out the steps just as a refresher.

  1. Navigate to the fourth SharePoint list – Supply Chain Scorecard Actuals.
  2. Open the InfoPath form by clicking on the Customize Form button in the List menu.
  3. Remove the following rows from the form:  Title, Metric, UOM, ItemDescription, UniqueItem, ListSort. 
  4. Set up the Metric ID lookup:
    1. Edit the Metric ID label to say “Section” and right click on the textbox and Change the Control to a Drop-Down List Box.
    2. Right click again and select Drop-Down List Box Properties. Select Get choices from an external data source
    3. Click the Add button beside the Data source.
    4. Create a new connection to Receive data.
    5. From a SharePoint library or list
    6. Enter your SharePoint site URL
    7. Select the Supply Chain Scorecard Metrics list.
    8. Select all of the fields that you created. Sort by ListSort.
    9. Next and Finish.
    10. Change the Value field to ID and the Display name to ItemDescription. Click OK.
  5. Edit the Metric field properties.
    1. Right click Metric, Field Properties.
    2. Click on the expression builder button beside Value.
    3. Click on Insert Field or Group. Click on Show Advanced View.
    4. Select Supply Chain Scorecard Metrics. Navigate to dataFields and then to ItemDescription.
    5. Click on Filter Data.
    6. Click on Add.
    7. Select ID in the first drop down, leave “is equal to” in the second drop down.
    8. In the third drop down choose Select a field or group. Change the data connection in the drop down to Main. Navigate to dataFields and then to Metric ID. Click all of the OKs.
  6. Edit the Title field properties. Set it to equal Metric.
  7. Edit the ItemDescription field properties. Set it to equal Metric.
    • concat(Section, " – " , Metric)
  8. Edit the UniqueItem field properties. Set it equal to the Year + Metric ID field.
  9. Edit the ListSort field properties. It will end up looking like this: concat(Year, ListSort[ID = Metric_ID])
    1. Enter the formula “concat (“, click on the Insert Field or Group button and select the Year field.  Key in a comma some space and a “)”.  Place the cursor right before the close bracket.  You will insert the Metrics ListSort field here. 
      • concat(  Year, <insert Metric ListSort here> )
    2. Show advanced view. Select the Supply Chain Scorecard Metrics data connection.
    3. Navigate to dataFields and select ListSort.
    4. Select the Filter Data button. Click Add.
    5. Select ID in the first drop down, leave “is equal to” in the second drop down.
    6. In the third drop down choose Select a field or group. Change the data connection in the drop down to Main. Navigate to Metric ID. Click all of the OKs.
  10. Publish the InfoPath form.

Navigate to the list. Add an item.

Display a Look up field on the Form:

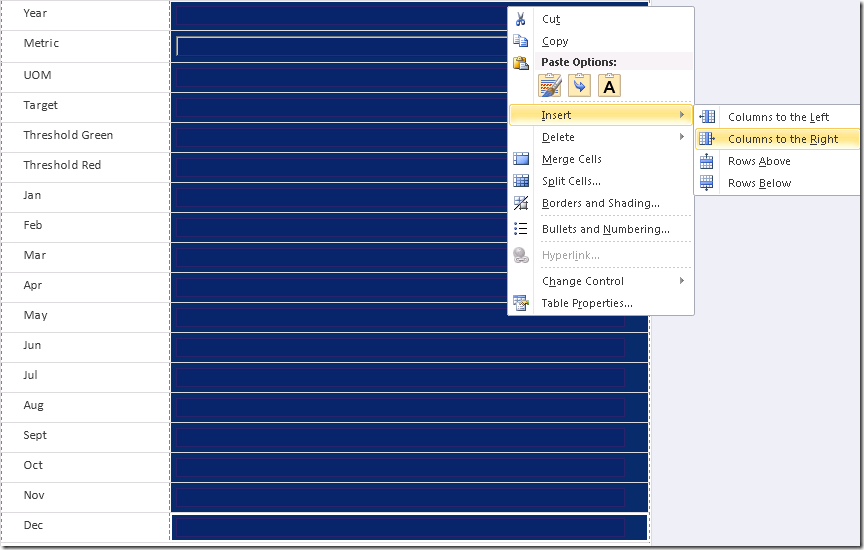
You notice that it would enhance the user experience to be able to see the UOM beside the Target, Thresholds and Monthly Actuals on the form when editing or adding an item.  We will look up the UOM and keep it on the form as a ‘display only’ so when the user is entering the targets and actuals they will be aware of the UOM for the Metric.

Highlight the entire right hand column, right click and select Insert –> Columns to the Right.
image

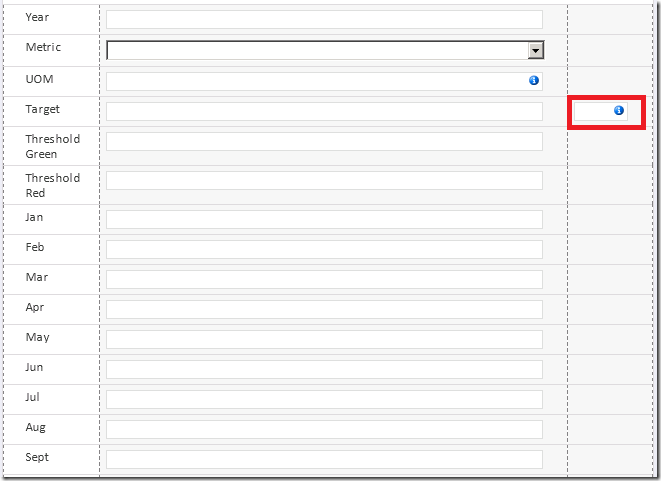
Drag the left edge of the new column to make it smaller.  Drag the UOM field from your Fields list onto the form, in the cell beside Target.  Delete the Label that says UOM beside the textbox you dragged onto the form.
image

Right click on the textbox and select Text Box Properties.  On the Data tab click on the expression editor button.
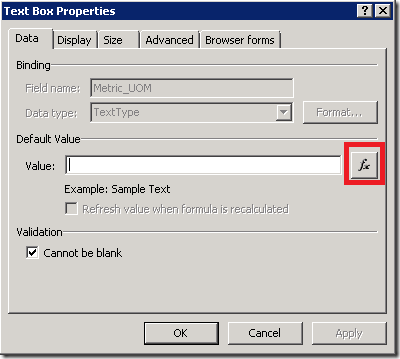
image

Click on the Insert Field or Group button.  Click on Show advanced view, and in the dropdown at the top select the Supply Chain Scorecard Metrics data connection.
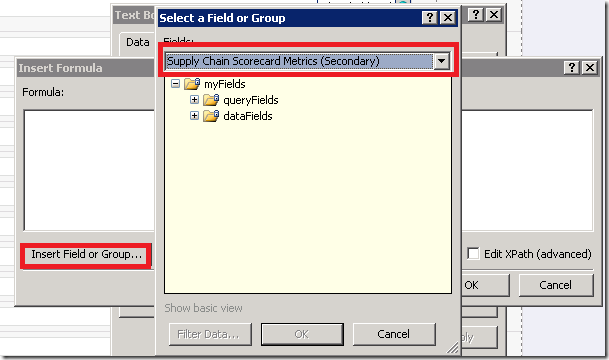
image

Navigate to dataFields and then to UOM.   Click on Filter Data. Click on Add.

Select ID in the first drop down, leave “is equal to” in the second drop down.  In the third drop down choose Select a field or group.

image

Change the data connection in the drop down to Main. Navigate to Metric ID.

image

Click all of the OKs until you get back to the Text Box Properties window.  Click on the Display tab.  Check off the Read-only box.  Click OK.

image

Right click on the UOM text box you created and select Borders and Shading.  Change Borders to None.  Change the shading to No Color. This will make it look like part of the form, instead of as a text box which might be editable.

Right click on the UOM text box you created, and select Copy.  Paste it into each of the cells where you would like to display the UOM on the form.
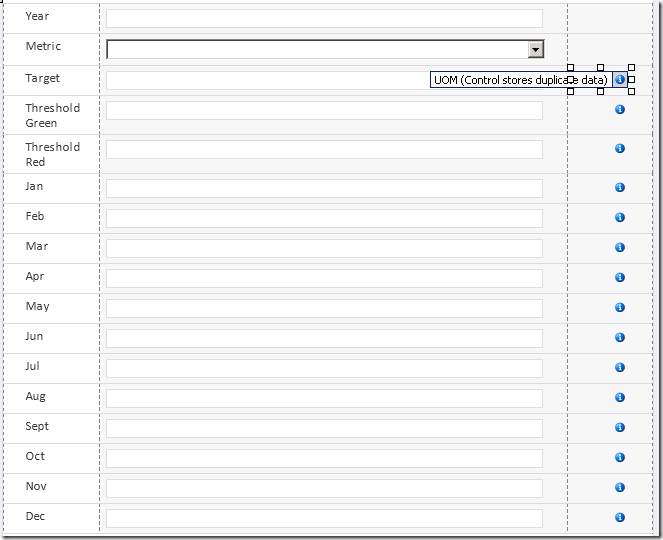
image

Publish the InfoPath form. Navigate to the list and add an item.  Notice that as soon as you select a Metric the UOM appears beside all the textboxes to be populated with that metric by the user.
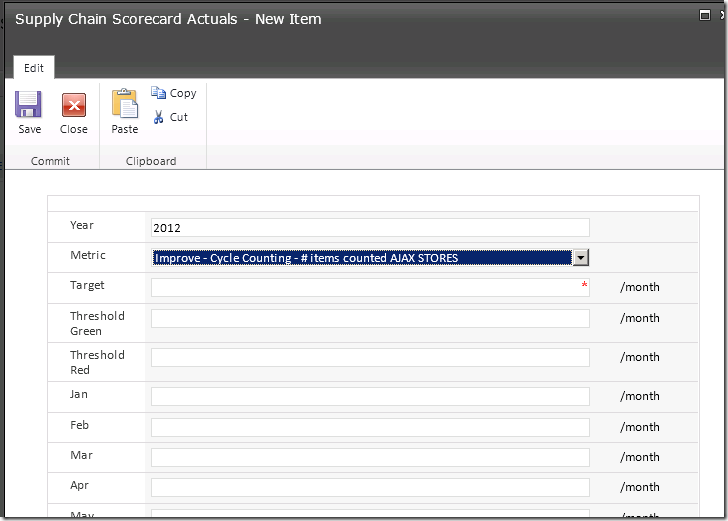
image

There are lots of other things you can do with InfoPath, but I think this is more than enough to get you started. 

I have also blogged a few other related subjects while writing this post, since this one already covered so much.  These two are a continuation of the example started here.

Use a SQL Server data source for an InfoPath pick list

Dynamically filter a drop down on your SharePoint list by another user selected value

You might also find this interesting:

How to use a SharePoint list as a Data Source in your SSIS Package

Maintaining Data Integrity of a SharePoint list with SSIS

Compare Week Last Year for a 53 Week Year Using MDX

Many companies use 4-4-5 calendar which ends up with an extra week approximately every 5 years.  This makes comparing periods challenging when you encounter the 53 week year.  This is especially challenging when reports are driven from an SSAS cube data source, and you want to build in the logic to automatically compare the correct This Year period with the corresponding Last Year period as per the companies business rules.  There is a way to do this.  It isn’t pretty, but it works.  The reporting will automatically choose the correct matching period in the context of a 52 or 53 week year.

There are some possibilities.  A company may want to compare the year after a 53 week year by shifting each week of the 53 week year by 1 week.  For example, if 2012 is the 53 week year then we want to compare:

image

Another possibility is that the company may want to compare the 53 week year by shifting the previous year weeks, or in some other way identify whether a week belongs to a 52 or a 53 week year for purposes of comparing periods.  This requires a bit more under the hood, but also doable. 

image

COMPARE THE YEAR AFTER A 53 WEEK YEAR WITH THE CORRESPONDING SHIFTED WEEKS FOR LAST YEAR

This is relatively easy.  Basically you make all your Last Year (LY) calculations and LY Period To Date calculations by counting back 52 weeks from the current week.  The week in your hierarchy must always be selected in your query.  I use Fiscal Week ID as the level to which I map all previous period calculations, so the Fiscal Week ID must be selected in all queries using these calculations.

This calculation will return the [Sls Dollars LY TW] (last year this week)

(PARALLELPERIOD
    ( [TIME].[Week Period To Date].[Fiscal Week ID], 52, [TIME].[Week Period To Date].CURRENTMEMBER  )
,[Measures].[Sales Dollars])

image

Notice how 2013 Wk 1 shows 2012 Wk 2 for the Sls Dollars LY TW.  And 2012 Wk 2 shows 2011 Wk 2 as desired.

For Periods To Date you can do this the same way.  You would like the LY QTD for 2013 Wk1 to show the QTD up to 2012 Wk 2.

This query returns [Sls Dollars LY QTD].

Aggregate
(
  PeriodsToDate
  (
            [TIME].[Week Period To Date].[Fiscal Quarter],

             PARALLELPERIOD
            ( [TIME].[Week Period To Date].[Fiscal Week ID],52,
                [TIME].[Week Period To Date].CURRENTMEMBER
            )
  ),
[Measures].[Sales Dollars]
)

Here are the results.  Again, you must have the Fiscal Week Id from the hierarchy selected in your query for this to work.

image

Notice how 2013 Wk 1 shows 2012 Wk 2 QTD for the Sls Dollars LY QTD. And 2012 Wk 2 shows 2011 Wk 2 QTD as desired.

IDENTIFY WHETHER A WEEK FALLS IN A 52 OR A 53 WEEK YEAR FOR USE IN CALCULATIONS

Here is an example of how to identify whether a week falls in a 52 or 53 week year, in order to be able to use in your calculations.  It isn’t pretty, but it does the job.

1.  Add a column to your DIM_Date table to identify whether a year has 52 or 53 weeks. 

image

2. Add a named calculation to the DIM_Date table in your cube Data Source View. 

image

The calculation is FiscalWeeksCount*10000+FiscalYearID. This will give you an integer which begins with either 52 or 53 and ends with the Year.  For example 522011 or 532012.

image

3. Add this calculated field to your Time dimension. Add it as a level of your Time Hierarchy, directly after Fiscal Year.  You may prefer to create a new hierarchy specifically for reporting needs so as not to confuse users. 

image

The reason the Year is appended to the Fiscal Weeks Count, rather than having the Fiscal Year roll directly up to Fiscal Weeks Count is that that would disturb the order of the children. 53 would come after 52 in the hierarchy, and therefor 2012 would come after 2013. The MDX calculations use relative position in the hierarchy to find a previous period, so the weeks must remain in the correct order in the hierarchy in order for this to work.

4. Save the change and rebuild the cube. Now you can reference this level in the hierarchy in order to identify how many weeks in the fiscal year.  You can use it in a case statement, like this:

CASE
WHEN [TIME].[Fiscal Weeks Count Year].CURRENTMEMBER.MEMBERVALUE > 530000 THEN
(PARALLELPERIOD ( [TIME].[Week Period To Date].[Fiscal Week ID], 53, [TIME].[Week Period To Date].CURRENTMEMBER ), [Measures].[Sales Dollars] )
ELSE
(PARALLELPERIOD ( [TIME].[Week Period To Date].[Fiscal Week ID], 52, [TIME].[Week Period To Date].CURRENTMEMBER ), [Measures].[Sales Dollars])
END

This determines if the current selected week falls in a 52 or a 53 week year, and calculated the corresponding previous period accordingly.  You could use ANCESTOR if you want to find out if the previous year was a 52 or a 53 week year.  You now know where your selected week is relative to a 53 week year and can use this information as needed.

Filter a Parameter with Long List of Values Using Type Ahead

I have a customer who has huge numbers of SKUs. Their reporting is using an SSAS cube as the data source. When filtering an SSRS report the users have to scroll through many many records to get to the SKU they want.   There is a type-ahead feature built into SSRS but you have to type superfast and hit it exactly in order to make it work.  I came across this great solution, and would like to blog the step-by-step with a cube as datasource. 

The solution is basically to add an additional text parameter which will prefilter the available values in the large parameter list.  This way the user doesn’t have to scroll through the long list to find the item they want, but can produce a shorter picklist, or even reduce the list down to one value if they type the exact SKU in.  They still have to check the box on the item they want, even if they’ve typed it all in, but it is still a good option when dealing with huge lists.

1. Alter your existing Available Values query to include the new pre-filter parameter.

When you created the original parameter in the report BIDS automatically created the dataset for the Available Values in the parameter.

image

You need to alter this query to use an additional pre-filter text based parameter.

1. Show hidden datasets.  Right click on your data source and select Show Hidden Datasets

image

2. Find out which dataset is being used by your parameter in the Available Values.  Right click on the parameter and select Parameter Properties.  Select the Available Values tab and find the name of the query being used.

image

3. Open up the dataset query.  Right click on the dataset you just identified, and select Query.

image

4. Add a parameter to the query.Click on the parameter button in Query Designer.

image

Type in the name of the new Parameter you would like to add for the type-ahead prefilter, and put in a Default value.  Don’t worry, you can change the default value in your Parameter Properties later if you wish.

image

Select OK.

5. Add the highlighted additional line of MDX to your query. Place the line right before the very last FROM [nameofcube], and add a close bracket at the end of the query.  This MDX will further filter your available values based on what is typed into the prefilter you are creating.

WITH MEMBER [Measures].[ParameterCaption] AS [Product].[Style Code].CURRENTMEMBER.MEMBER_CAPTION MEMBER [Measures].[ParameterValue]
AS [Product].[Style Code].CURRENTMEMBER.UNIQUENAME MEMBER [Measures].[ParameterLevel] AS [Product].[Style Code].CURRENTMEMBER.LEVEL.ORDINAL
SELECT {[Measures].[ParameterCaption], [Measures].[ParameterValue], [Measures].[ParameterLevel]} ON COLUMNS , [Product].[Style Code].ALLMEMBERS ON ROWS
FROM ( SELECT ( STRTOSET(@ProductDivisionCode, CONSTRAINED) ) ON COLUMNS
FROM ( SELECT (IIF(LEN(@ProductStyleCode_filter) =0, ([[Product].[Style Code].ALLMEMBERS), (FILTER([Product].[Style Code].ALLMEMBERS, INSTR ([Product].[Style Code].CURRENTMEMBER.MEMBER_CAPTION , @ProductStyleCode_filter) > 0)))) ON COLUMNS
FROM [Sales and Inventory])     )  

Click OK to save your Query.

BIDS has created your new paramater for you.  Now you can edit the default value of your parameter if you like, and then test your report. All should be working as expected.

Thanks to Thomas Puch and Ella Maschiach for their blogs on the subject.

How To Default SSRS Parameter to Current Month using an SSAS Data Source

When dealing with report parameters that involve time, I usually like to default the report to the current unit of time used by the report, often month.  When a user views the report in a particular month the parameter will always default to that month, saving the user from having to select it every time.

There are two elements to making this happen.  One is to define the current month in your Time dimension,  and the other is to build the dataset into your report to feed the default for the Time parameters.

1. Define current month in the SSAS Time dimension

I know there is Time functionality built into SSAS cubes, but I still like the flexibility of building attributes into my DIM_Date table in the data warehouse.  In this way it can be used in both cube and SQL queries alike.  I won’t go into details about how the Dim_Date table is created as that is another subject.  The DIM_Date table is rebuilt nightly and an attribute called MonthPeriod identifies whether the date is in Current Month, Previous Month, etc.  You can label any months you like, with your own descriptions.  Some examples are below.

image

The important thing about this attribute is to ensure that MonthPeriodID for the current month is always 0, and the MonthPeriodID for other months is relative to that. So ‘Current Month –1’ is 1, ‘Current Month –2’ will be 2, etc. This way you can build logic into your reports which relies on the fact that, for example, last month has a MonthPeriodID of 1.  It is critically important that the underlying ids belonging to each description are always the same.  If Current Month is 0 today and changes to 10 tomorrow, the defaults in your reports will not work.  SSRS stores the MDX tuple associated with the description and not the actual description. So when you select ‘Current Month’ in step 3 below, SSRS is storing [TIME].[Month Period].&[0] and not the ‘Current Month’ label.

Once you have this attribute defined in your DIM_Date table and it is being updated nightly, add it to the SSAS cube for use in your reports.

2. Build the default dataset into your report to feed the SSRS Parameter.

Background:

When you build the main dataset for the report and add parameters in your dataset,

image

SSRS automatically creates the dataset for the Available Values for the parameter. You can view these hidden datasets used to feed Available Values by right clicking on [Datasets] in the [Report Data] window in SSRS and selecting [Show Hidden Datasets]. 

image

You can view and/or edit any of these hidden datasets.

image

I don’t recommend editing the hidden datasets, since they are created and used by SSRS by default and your changes can sometimes be overwritten if you add additional datasets using the same parameters.  If you wish to customize the Available Values you are better off creating a new dataset with a different name specific to that purpose and then changing Report Parameter Properties to use the new dataset to retrieve the Available Values.

image

Building the Default Dataset

For this particular report the user can choose Year and then Month Of Year.  The same dataset can be used to feed both the default current year and the current month. 

1. Right click on Datasets in the Report Data window and select Add Dataset.

2. Select the Radio Button ‘Use a dataset embedded in my report’.  I like to use Shared Datasets for this type of thing, but for some reason shared datasets used for defaults with an SSAS data source don’t seem to work when published to SharePoint.  So for now just embed it in the report.  Select (or define) the cube you are using as your Data source, and click on the Query Designer button.

image

3. From the TIME dimension drag the ‘Month Period’ attribute defined in Part 1 to the filter area of the Query Designer.  Click in the Filter Expression and select ‘Current Month’. Click OK.

image

4.  Drag Year and Month of Year onto the Query design page.  Right click on the design page and select ‘Include Empty Cells’ so the current attributes will appear when the query is executed.

image

5. Right click in the Calculated Members area and select ‘New Calculated Member’.  From the Metadata pane drag the Year attribute from the TIME dimension into the Expression pane.  Add to the end of the expression “.CurrentMember.UniqueName”.  Give the Calculated Member a name of ‘YearValue’.  Click OK.

image

6. Right click on the new calculated member called YearValue and select Add to Query.

image

7.  Add another calculated member following steps 5 & 6 called MonthOfYearValue. 


image

8. Your dataset now contains the Label and the underlying MDX tuple needed to feed the default time values to your report parameter.

image

9. Click OK to close out of the Query Designer.  Give the dataset a name of DefaultYearMonth. Click OK to save the dataset.

10. Double click the TIMEYear parameter in the Paramaters folder of the Report Data window to edit the Report Parameter Properties. Select the Default Values option. Choose the ‘Get values from a query’ radio button.  In the dataset drop down choose the DefaultYearMonth dataset you created.  In the Value field dropdown select YearValue.

image

11. Do the same as Step 10 for the TIMEMonthOfYear parameter.  Select DefaultYearMonth as the dataset, and MonthOfYearValue for the Value field.

When you preview your report, the parameters will now default to the current year and month.  Going forward the default for the parameter will roll over to whichever month is current.  Users appreciate not having to choose the current month every time they look at a report.

image

How To Use a SharePoint List as a Data Source in your SSIS Package.
Sometimes you run into a situation where you want to allow users to update data in a simple fashion, and incorporate the data into a data warehouse.  For example the client’s ERP system maintains the data element called Departments but doesn’t have the ability to store Department Groups for reporting since it is not relevant to the ERP system.  Using a SharePoint list as a data source can be an easy solution.  Users can update it very simply, your ETL package can add or update new Departments from the ERP system via the data warehouse, and you can pull the user entered data back into the data warehouse.  There are some drawbacks to it, such as lack of data integrity checks on the SharePoint side.  But if you build your ETL package right, you can correct any integrity issues which might be created by user error. 

Here is what I will demonstrate, using a SharePoint list to manage the applying Department Groups to Departments which are maintained in the accounting system:

PART 1 – DOWNLOAD AND INSTALL SSIS TOOLBOX ITEMS
PART 2 – USE THE SHAREPOINT LIST AS A DATA SOURCE

PART 3 – INSERT RECORDS INTO THE SHAREPOINT LIST

PART 4 – UPDATE RECORDS INTO THE SHAREPOINT LIST

PART 5 – DELETE RECORDS INTO THE SHAREPOINT LIST

PART 6 – BUILD DATA INTEGRITY INTO YOUR PACKAGE

PART 1 – DOWNLOAD AND INSTALL SSIS TOOLBOX ITEMS

1. From the server where you will be building the SSIS solution, open your browser and navigate to this URL. http://sqlsrvintegrationsrv.codeplex.com/releases/view/17652

2. Download, run and follow the instructions to install SharePointListAdaptersSetup.msi (2008) or SharePointListAdaptersSetupForSqlServer2005.msi

image

3. Close BIDS if it is open

4. Open BIDS from the Tools menu select Choose Toolbox Items.  Go to the SSIS Data Flow Items tab. – **See SQL Server 2012 Update at the end of this post.

image

5. Add a checkmark to the SharePoint List Destination and SharePoint List Source items.

6. Open up or create a new Integration Services solution. Go to the Data Flow tab.

7. Open up the Toolbox

8. Drag SharePoint List Source from the General section…

image

…to the Data Flow Sources section.

image

9. Drag SharePoint List Destination from the General section…

image

…to the Data Flow Destinations section.

image

Now you are ready to use a SharePoint List as a source or destination in your packages.

PART 2 – USE THE SHAREPOINT LIST AS A DATA SOURCE

1. Create a Data Flow in your package.

2. Go to the Data Flow tab and drag the SharePoint List Source into the data flow as your source.

image

3. Double click on the source.  Scroll down to the bottom where it says SiteURL.

image

4. Paste the URL for the SharePoint site into the SiteURL (exclude anything from the word Lists onward in the URL)

Example: if your SharePoint site URL for Lists is

 http://ca-shpt01/Reporting/Lists/Department%20Groups/AllItems.aspx

then only type

http://ca-shpt01/Reporting/

5. Type the SiteListName.  For example if your List name is Departments,

image

then type “Departments”.

image

6. If you are wanting to import data from a particular view of this list in SharePoint, other than the default view, “MyView” for example:

image

then add the name of the view in the SiteListViewName, otherwise leave it blank.

image

7. Click the Refresh button at the bottom of the box to load the SharePoint List metadata into your Data Flow.

image

8. Then click on the Column Mappings tab to see the columns available from your SharePoint list.

image

9. Drag a Data Flow Destination onto your data flow and proceed as normal to pull data into your destination from the SharePoint list.

You’ll need to know a little about SharePoint lists to understand what data lives in which column.  You’ll need the ID column if you will be doing any updating from the data warehouse into the SharePoint list.  The Title is whatever item is the linked item in the SharePoint list – meaning if a user clicks on one of the items in the SharePoint list, which field is set up as the hyperlink to the item (usually the first column visible in the list).

image

Because there is often a  push and a pull of data to and from the SharePoint list I tend to create a table in the data warehouse  specifically for the data from the SharePoint list and I let the source data dictate the table structure by clicking on the New button for the “Name of the Table or view”.  In this way, when the data gets pushed back to SharePoint there are no data type issues.

PART 3 – INSERT RECORDS INTO THE SHAREPOINT LIST

Keep in mind that the SharePoint list does not manage any data integrity, so if you add duplicate records with the same linked “Title”, Department Name in this case, you will get duplicate records in your list.  Be sure to configure your data source to insert only new records, not existing records. Here we will add any new Departments that have been added to the ERP system (if any) and push them up to SharePoint.

1. Add a Data Flow to your package.

2. Go to the Data Flow tab and drag an OLE DB source as your source. Configure your source to pull any new Departments that you want to insert into the SharePoint list.  In this example SP_Department is the data which has been imported from the SharePoint list, and DIM_Department holds the Departments imported from the ERP system:

SELECT   �
DP.Department_Code,
DP.Department_Description
FROM  SP_Department as SP RIGHT OUTER JOIN
dbo.DIM_Department as DP ON SP.Department_Code = DP.Department_Code�
    WHERE      SP.ID IS NULL

3. Drag the SharePoint List Destination into the data flow as your destination.

image

4.  Double click on the SharePoint List Destination and configure the SiteUrl, SiteListName and SiteListViewName the same way you did in Part 2 steps 4-6 above.  In addition, ensure that the BatchType is set to Modification.  “Modification” is used for Updates and Inserts, “Deletion” is of course for Deletions.

image

5. Click on the Refresh button in the bottom left of the Advanced Editor window and select the Input Columns tab.  Map the Source columns to the Destination columns.  Since we are INSERTING records, be sure NOT to map to the ID field. Doing so would have the data flow expect an update rather than an insert.

image

Note that the Department_Description is being mapped to the Title field, which is the linked SharePoint field described in Part 2 – item 9, above.

6. Run your data flow task and check the SharePoint list for the added records.

PART 4 – UPDATE RECORDS INTO THE SHAREPOINT LIST

Here we want to update the Department descriptions in SharePoint, in case a user has decided to edit it.  The only item the user should be editing is the Department Group.

1. Add a Data Flow to your package.

2. Add an OLE DB Source to the Data Flow tab and configure the source with the correct query to update the Department descriptions for Departments that already exist in the SharePoint list.  For example:

SELECT   �
SP.ID,
DP.Department_Code,
DP.Department_Description
FROM  SP_Department as SP INNER JOIN
dbo.DIM_Department as DP ON SP.Department_Code = DP.Department_Code 

3. Drag the SharePoint List Destination into the data flow as your destination.

image

4.  Double click on the SharePoint List Destination and configure the SiteUrl, SiteListName and SiteListViewName the same way you did in Part 2 steps 4-6 above.  Esure that the BatchType is set to Modification. 

image

5. Click on the Refresh button in the bottom left of the Advanced Editor window and select the Input Columns tab.  Map the Source columns to the Destination columns.  Since we are UPDATING records, BE SURE TO map to the ID field. Without the ID the data flow will implement an insert rather than an update.

image

6. Run your data flow task and check the SharePoint list for the updated Department Descriptions.

PART 5 – DELETE RECORDS INTO THE SHAREPOINT LIST

Here we want to delete any Department records from the SharePoint list that a user may have entered in error. The user training indicated to users that Departments should only be added from the ERP system and not by users.

1. Add a Data Flow to your package.

2. Add an OLE DB Source to the Data Flow tab and configure the source with the correct query to select the Departments for deletion from the SharePoint list.  The only field you need in the result is the ID field which maps to the ID in the SharePoint List.  If the ID is in this query it will get deleted from the SharePoint list.  In this example we will remove any duplicate records, and remove any Departments that don’t exist in the ERP system:

–DELETE DUPLICATE Department Codes.  Take the oldest record.
SELECT ID FROM SP_Department
WHERE Department_Code IN (
SELECT DP.Department_Code FROM  SP_Department as SP LEFT OUTER JOIN
dbo.DIM_Department as DP ON SP.Department_Code = DP.Department_Code�
GROUP BY DP.Department_Code HAVING COUNT (sp.id) > 1)
AND ID NOT IN
(SELECT MIN(ID) FROM SP_Department
WHERE Department_Code IN (
SELECT DP.Department_Code FROM  SP_Department as SP LEFT OUTER JOIN
dbo.DIM_Department as DP ON SP.Department_Code = DP.Department_Code�
GROUP BY DP.Department_Code HAVING COUNT (sp.id) > 1))

UNION
–DELETE Department Codes that don’t exist in ERPSELECT SP.ID FROM  SP_Department as SP LEFT OUTER JOIN
dbo.DIM_Department as DP ON SP.Department_Code = DP.Department_Code
WHERE      DP.Department_Code IS NULL

3. Drag the SharePoint List Destination into the data flow as your destination.

image

4.  Double click on the SharePoint List Destination and configure the SiteUrl, SiteListName and SiteListViewName the same way you did in Part 2 steps 4-6 above.  In addition, ensure that the BatchType is set to Deletion.

image

5. Click on the Refresh button in the bottom left of the Advanced Editor window and select the Input Columns tab.  Map the ID input column to the ID destination column.

image

6. Run your data flow task and check the SharePoint list for the deleted Departments.

PART 6 – BUILD DATA INTEGRITY INTO YOUR PACKAGE

Putting this all together will enforce the data integrity for this simple list.  Here is what this package looks like.

image

Here is what each step does.

1.  Truncate Tables: Truncates these tables –

DIM_Department
DIM_Department_Group
SP_Department

2. Populate DIM_Department – populates the DIM_Department table from the ERP system.

3. Retrieve Dept Group from SP – Populates the DIM_Department_Group table from another SharePoint List.  This is used as a drop down in the Department SP list for users to select the correct department.

4. Retrieve SP_Depts – Populates the SP_Department table from the SharePoint list. See Part 2 above.

5. Update SP Dept Descriptions – updates any modified Department descriptions.  See Part 4 above.

6.Add Missing Depts to SP – adds any new or missing Departments to the SharePoint list.  See Part 3 above.

7. Delete invalid Depts from SP – deletes any invalid Departments from the SharePoint list. See Part 5 above.

8.  Truncate SP_Depts – Truncate the SP_Department table in preparation for reload of corrected data.

9. Retrieve Updated SP_Depts – Populate SP_Department table from the updated SharePoint list. See Part 2 above.

10.  Update Dept Group Codes – Updates the DIM_Department table with the Department_Group_ID.

UPDATE DIM_Department
   SET Department_Group_ID = SP.Department_Group_ID
   FROM SP_Department AS SP INNER JOIN
DIM_Department as DP on DP.Department_Code = SP.Department_Code

This may seem like a lot of work, but it actually doesn’t take that much time once you get the hang of it.  Of course if you have more complex lists or require a lot of lists to manage this kind of data, you will want to look into other tools.  This is a good solution to the occasional one-off with a fairly simple data requirement, where the client doesn’t have another tool available to handle it.

Update April 24, 2012

If you are populating date fields, see this post.  http://thedataqueenblog.azurewebsites.net/2012/04/populating-date-fields-in-sharepoint-using-ssis/

Update May 2, 2012

SQL Server 2012:   All components that are installed on the local machine now automatically appear in the new SSIS Toolbox. When you install additional components, right-click inside the toolbox and then click Refresh Toolbox to add the components. The SharePoint List Destination and the SharePoint List Source appeared in the “Common” folder in the SSIS Toolbox when I refreshed the toolbox.